
Sleep & heart · topic 5 of 5
Heart rate recovery
One cited line, and why there is no second one
The fall in the first minute, bpm
Below the line is a cited finding. Above it is a gradient, not a grade: published cut-points span 12 to 30 depending on the study and the protocol, so Verve shades and refuses to print a verdict word.
Heart rate recovery is the drop from your peak exercising heart rate to the rate a fixed time later — most often one minute. The early part of that fall is driven mainly by the vagus nerve switching back on; slower sympathetic withdrawal follows over the next few minutes. It is, in effect, a read of how quickly your autonomic nervous system lets go of effort — and it predicts mortality independently of how fit you are or how much coronary disease you have.
The one line Verve draws is 12 bpm.In the original study of 2,428 people, a fall of 12 beats or fewer in the first minute carried roughly a four-fold higher mortality risk over six years. The American Heart Association’s exercise-testing statement names it the most frequently used cut-point, and a 2025 cohort found the same threshold associated with a hazard ratio of about 3.2 for death at 72 months. That is why the scale on the card is red up to 12 and marks nothing else as a verdict.
Why there is no “good” number.You will see 18–20 bpm quoted as a healthy recovery. It is a lay benchmark, not a validated norm: published cut-points for one-minute recovery run anywhere from 12 to 30 bpm depending on the study, the population and the protocol. What the evidence does show is that the relationship is not a switch. Risk falls steeply as recovery improves to somewhere around 15–20 bpm, then the curve flattens — beyond that range, extra recovery buys little further protection. Verve shades the scale above 12 from amber towards green to say exactly that, and deliberately draws no second line.
The number depends on what you do after you stop.Recovery measured while walking slowly is different from recovery measured sitting or lying down; passive recovery produces larger drops and needs higher cut-points. The 12 bpm line was derived with an active walking cool-down. Apple Watch measures recovery in whatever you happen to do after ending a workout, which is one more reason the comparison Verve leads with is you against your own 30-day median — the same rule as resting heart rate — rather than you against a table. Your protocol is at least consistent with itself. Recovery also declines with age and is higher in adolescents, so a fixed adult line is not applied to younger users.
Shown but not scored.The line was measured after hard effort, and how far the rate falls scales with how high it went. A walk that ended below your own Zone 2 floor still has a fall, and the page shows it, in grey, with “ended below Zone 2” beside it — but it is not judged against the 12 bpm line, not counted among the readings above or below it, and not in the week average. It is what the watch measured; it is not a fitness reading.
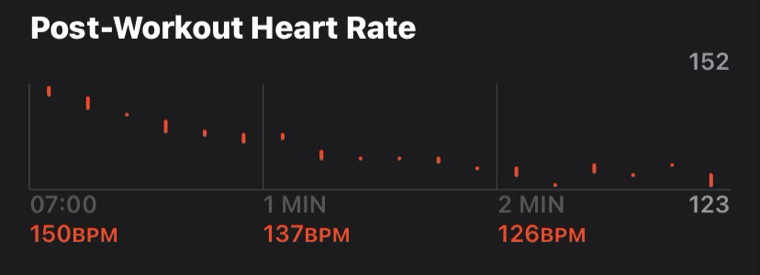
Where the number comes from.Two places, and the card says which. Apple Watch stores a one-minute recovery for a workout when it sees an undisturbed minute after you tap End; Verve reads that value as it is. But the watch keeps recording your heart rate for about three minutes after every workout whether or not it stores a recovery — a run followed straight by a walk gets none — and the Fitness app draws that as “Post-Workout Heart Rate”. For a recent workout with no stored reading, Verve takes the same two points the Fitness app shows, the rate at the end of the workout and the rate one minute later, and reports the difference, markedfrom workout HR. Nothing is smoothed, fitted or assumed: two readings, one subtraction.
Why Verve’s number can differ from the one on the Fitness chart.Open a workout in Fitness and you will see a number under each minute of the post-workout chart. Those numbers summarise the chart. They are not the recovery measurement, and subtracting one from the next gives a figure nobody validated. Apple keeps the recovery separately, worked out its own way: the highest rate it saw once recovery had begun, minus the rate one minute later. The two disagree because they do not start at the same moment. The chart starts the instant you tap End; the stored figure starts a little later, once the watch is satisfied that recovery has actually started, so it begins from a lower rate. On one run here the chart read 150 then 137, a fall of 13, while the watch stored a fall of 25 for the same minute.
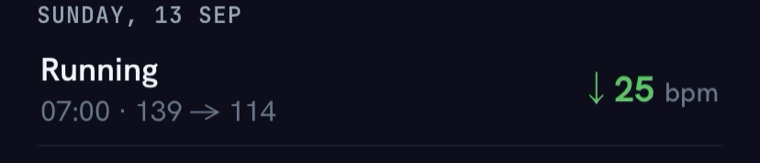
Which one Verve shows, and why that is the right one.The stored figure, unchanged and unrounded, for two reasons. It is the number Apple itself commits to for that workout, so Verve is not second-guessing your watch with arithmetic of its own. And it is measured the way the research measured it — from the effort down through the first minute — which is what makes the 12 bpm line above mean anything at all. A number read off a chart cannot be compared with a study that measured something else. When the watch stores nothing, Verve says so by marking the reading as its own, so you always know which of the two you are looking at.
Where the readings live.The Activity page shows this week, Monday to today, every reading under the day it happened. Earlier weeks are in Trends, under Over Time, as the period average beside resting HR, the way every other measure works.
Your own usual.The app does not print a “vs usual” figure; the reading is the reading. The yardstick worth keeping in mind is the median of your own recoveries over the last 30 days — the rule the resting heart rate tile uses — because there is no population “good” to compare with: above 12 bpm the evidence is a gradient, not a second line. A recovery is one number per workout, not per day, so it takes a handful of workouts before that median means anything, and a single low reading after a hard, hot or back-to-back session is a session, not a trend.
Cole et al — Heart-rate recovery immediately after exercise as a predictor of mortality, NEJM 1999
2,428 adults referred for exercise testing, followed for six years. A fall of 12 beats or fewer in the first minute after stopping was associated with roughly a four-fold higher risk of death, independent of workload and of changes on the ECG. This is the origin of the single line Verve draws — and the source of the risk curve that falls steeply to about 15–20 bpm and then flattens, which is why Verve shades above the line rather than drawing a second one.
nejm.org →
Fletcher et al — Exercise standards for testing and training, AHA Scientific Statement, Circulation 2013
The AHA statement names ≤12 bpm at one minute as the most frequently used abnormal cut-point, and spells out that the magnitude of recovery depends on the protocol: an upright active cool-down produces different values from stationary, seated or supine recovery, with higher cut-points for passive protocols. The original threshold was derived with active walking. It is the reason Verve reads your recovery against your own consistent protocol first.
ahajournals.org →
Costa et al — Heart rate recovery and mortality in a 72-month survival analysis, Cadernos de Saúde Pública 2025
A recent cohort confirming the cut-point a quarter-century on: abnormal one-minute recovery (≤12 bpm) was associated with a hazard ratio of 3.16 for all-cause mortality at 72 months. Two independent populations landing on the same line is what earns it a place on the card.
PMID 42090691 →
Vivekananthan et al — Heart rate recovery predicts mortality independent of angiographic coronary disease, JACC 2003
Recovery predicted death even after accounting for how much coronary disease was visible on angiography. The autonomic signal is its own risk factor, not a proxy for blocked arteries — which is why it belongs beside resting heart rate rather than inside a heart-disease panel.
PMID 12957428 →
Petek et al — Consumer wearable technology in cardiovascular medicine, JACC State-of-the-Art Review 2023
Reviews what consumer wearables can and cannot measure. On recovery it is blunt: there are no universally accepted normative values, published cut-points span 12–30 bpm at one minute and 22–42 at two, and a fixed 'good' threshold overstates the precision the evidence supports. The recommendation Verve follows — show recovery as a trend against the person's own baseline, and say which protocol was used — comes from here.
PMID 37438010 →
Goldberger et al — Autonomic nervous system dysfunction, JACC Focus Seminar 2019
The physiology behind the number: early recovery is vagal reactivation, later recovery is sympathetic withdrawal. Also the source of the Jouven finding that one-minute recovery under 25 bpm roughly doubled sudden cardiac death risk against over 40 — a different dataset with different cut-points, underscoring that 12 is protocol- and population-specific rather than universal.
PMID 30871703 →